|
Singles Average
(BHIPx%)
Singles Average (BHIPx%)-
An indicator which measures the percentage of batted balls
which are
hit into play and are subsequently registered as singles
(Singles/(AB-K-2B-3B-HR)). The typical singles rate for the
entire MLB universe
is around .250. Every year there are
outliers that hit significantly below or significantly
above this average...of these, 80 to 85% are able to reverse that
trend the following season. Using this historical indicator, we can
surmise (based on batting average) which players will have a comeback or drop-off season.
Have you ever heard something similar to
this at a ballgame: "Come on pitcher let him hit the darn
ball...that's why you have a field full of players behind you"
There is a common perception that
balls hit into play, specifically singles, have a similar chance of
being registered as outs as falling in for basehits. Since 1913, the number of balls hit into
the field of play which have gone for singles is approximately 1 in 4 (.247).
Similar studies have been conducted on whether pitchers have control over balls
hit into play, but do batters
have control over these balls hit into play?
Before we get to the crux of the study,
I want to state the clear and seemingly obvious relationship
between Singles Average (BHIPx%) and Batting Average. Using data since 1913,
there is a .747 correlation between the two statistics. The mean
batting average over this period is .279, which is .32 points higher
than the singles percentage (BHIPx%). This of course should come as
no surprise as singles are the largest component of a
players BA.
My first objective is to
determine if the relationship between Singles Average is distinguishable based on
the individual batter. We all know that Home Runs and Extra Base hits
are very distinguishable based on the player, but are singles?
Secondly, how can we forecast future player Batting Average based on this
information.
Relationship between Singles Average and
the attributes of the player
To populate our database, we wanted to
only include batters who had over 400 ABs in a given season, and had
at least 4 consecutive seasons of service time. We started our
series back in 1980 (we felt that 25 years is an abundant sampling),
and the number of batters that met our criteria for any given year
averaged about 125. In the end, the results were almost identical
year after year.
For simplicity we are going to proceed
through the rest of this exercise showing the results over the last 4
years with the 2004 season being the ending point. Using the most
recent 4 years of data (criteria was over 400 ABs in 2004 with 3
consecutive years of previous history -> 2001-2003), there were 130
hitters who met these guidelines.
The percentage of balls hit into play
(Singles) that are not extra base hits or outs, are indeed based on the quality of
the batter. The grid below shows the relationship
between the years 2001-2004 for the pre qualified batters. Any
relationship above zero shows correlation, the closer to 1 the
greater the relationship. What we see below is a significant
relationship. Significant enough were there is a relationship
between the group's BHIPx% in 2001 and 2004 (.201734). If these results
were sporadic there would be values with negative numbers or values
closing in on zero....this is clearly not the case.
|
|
2004 |
2003 |
2002 |
2001 |
|
2004 |
1 |
|
|
|
|
2003 |
0.298056 |
1 |
|
|
|
2002 |
0.256274 |
0.285065 |
1 |
|
|
2001 |
0.201734 |
0.372215 |
0.331594 |
1 |
Relationship between the
Top/Bottom Hitters and Singles Average
Our next step is figure out if the relationship between a batter and
his ability to control his Singles Average (BHIPx%) is evident because of a
subset of hitters (like the best or worst at achieving a BHIPx%) or it is
casual relationship seen
throughout the sampling? Conclusion: it exists because of a
subset of hitters. Sorted by the top BHIPx% hitters (so you can
ignore the 2004 results in the chart below) there is a pretty clear
relationship between the top 20 hitters (.269 in 2003, .256 in 2002)
in producing higher than average Singles Average in 2003 and 2002, but
what drives the relationship is the low end hitters. The bottom 50
in our sample produced consistently lower than average results (.237
in 2003, .236 in 2002, and .238 in 2001).
|
|
2004 |
2003 |
2002 |
2001 |
|
Top 20 |
0.295 |
0.269 |
0.256 |
0.249 |
|
|
|
|
|
|
|
21-40 |
0.267 |
0.247 |
0.248 |
0.249 |
|
|
|
|
|
|
|
41-60 |
0.253 |
0.239 |
0.246 |
0.241 |
|
|
|
|
|
|
|
61-80 |
0.244 |
0.243 |
0.236 |
0.246 |
|
|
|
|
|
|
|
81-130 |
0.220 |
0.237 |
0.236 |
0.238 |
Observation:
1. There is a significantly high
percentage of hitters who do not have any control over balls hit into
play (Singles only). If we average out the middle of the pack
hitters (21-80 in our sample size) their average year in and year
out comes pretty close to the MLB average (.247 vs .247). I surmise*
to say maybe as many as 45% fall into this group.
2. There is another significantly
high percentage of hitters who have an unfavorable control over
balls hit into play (Singles only). If we average out the bottom
of the pack (81-130 in our sample size) their average year in and
year out is significantly below the MLB average (.232 vs 247). I again surmise*
to say maybe as many as 45% fall into this group.
3. There is a small percentage of
hitters who have a favorable control over balls hit into play
(Singles only). If we average out the top 20 in this sample (1-20 in
our sample size) their average year in and year out is significantly
higher than the MLB average (.267 vs .247). I surmise* to say maybe
as many as 10% fall into this group.
(*Surmise, because we are using a
sample size that has only players that have 4 consecutive years of
history and over 400 ABs in the given season. Thus we are omitting
players with a 2 or 3 year history as they do not meet our
consistency criteria)
Top Singles Average Batters
Of the Top 40 BHIPX% hitters from 2004
(see chart below), only 4 out of 62
exceeded their lofty numbers in
2005. The
top 20 hit at an average clip of .268 in 2005 after hitting at a
.295 clip the previous season (a 9% drop), with the next 20 hitting
at a .251 clip after hitting at a .267 the previous season.
Taking a look at the list below (sorted by top BHIPx% batters in
2004), you'll see a significant downturn in the results of many of
these players. This is not to say that some didn't make up for their
lack of singles by hitting extra base hits, but many suffered a
significant drop in batting average after highs the previous season.
Ichiro Suzuki was the poster boy for the group, after hitting
an astonishing Singles Average of .373 in 2004 (well over 50 points
above his 3 year average), Suzuki had a significant drop in his
Singles percentage in 2005 (.280), which heavily contributed to a 93
point drop in BA in 2005.
|
Player |
2005 |
2004 |
|
Suzuki,I. |
0.280 |
0.373 |
|
Sanchez, A. |
0.336 |
0.347 |
|
Gathright,J. |
0.299 |
0.342 |
|
Rodriguez,I. |
0.242 |
0.321 |
|
Franco, J. |
0.273 |
0.320 |
|
Saenz,O. |
0.207 |
0.319 |
|
Atkins,G. |
0.256 |
0.318 |
|
Giles, M. |
0.257 |
0.310 |
|
Surhoff,B. |
0.237 |
0.308 |
|
Mora,M. |
0.260 |
0.307 |
|
Mabry,J. |
0.220 |
0.307 |
|
Varitek,J. |
0.263 |
0.306 |
|
Michaels, J. |
0.297 |
0.305 |
|
Pierre, J. |
0.255 |
0.304 |
|
Womack,T. |
0.269 |
0.302 |
|
Castillo,L. |
0.289 |
0.301 |
|
Punto,N. |
0.241 |
0.300 |
|
Diaz,V. |
0.241 |
0.300 |
|
Kendall,J. |
0.251 |
0.297 |
|
Anderson,G. |
0.253 |
0.295 |
|
Logan,N. |
0.258 |
0.294 |
|
Lopez,J. |
0.244 |
0.293 |
|
Hollandsworth,T. |
0.231 |
0.292 |
|
Bigbie, L. |
0.255 |
0.291 |
|
Grudzielanek,M. |
0.281 |
0.291 |
|
Rios,A. |
0.255 |
0.290 |
|
Miles,A. |
0.275 |
0.290 |
|
Figgins,C. |
0.287 |
0.289 |
|
Burroughs,S. |
0.262 |
0.289 |
|
Cabrera,M. |
0.293 |
0.287 |
|
Hawpe,B. |
0.272 |
0.286 |
|
Perez,A. |
0.328 |
0.286 |
|
Gotay,R. |
0.205 |
0.286 |
|
Estrada, J. |
0.218 |
0.285 |
|
Nixon,T. |
0.225 |
0.284 |
|
Gomez,C. |
0.258 |
0.284 |
|
Erstad,D. |
0.269 |
0.284 |
|
Snow,J. |
0.276 |
0.283 |
|
Green,N. |
0.257 |
0.283 |
|
Young, M. |
0.299 |
0.283 |
|
Gonzalez,L. |
0.274 |
0.281 |
|
Kotsay,M. |
0.233 |
0.281 |
|
Freel, R. |
0.261 |
0.281 |
|
Loretta,M. |
0.266 |
0.280 |
|
Bellhorn, M. |
0.219 |
0.280 |
|
Long,T. |
0.263 |
0.280 |
|
Stewart,S. |
0.253 |
0.280 |
|
Clayton,R. |
0.279 |
0.279 |
|
Kennedy,A. |
0.306 |
0.279 |
|
Beltre,A. |
0.223 |
0.278 |
|
Peralta,J. |
0.268 |
0.278 |
|
Dejesus,D. |
0.263 |
0.277 |
|
Crisp,C. |
0.255 |
0.276 |
|
Hairston,J. |
0.224 |
0.275 |
|
Guerrero,V. |
0.249 |
0.275 |
|
Castillo,J. |
0.246 |
0.274 |
|
Cantu,J. |
0.229 |
0.274 |
|
Overbay,L. |
0.244 |
0.273 |
|
Helton,T. |
0.265 |
0.273 |
|
Inge,B |
0.250 |
0.272 |
|
Cairo,M. |
0.225 |
0.272 |
|
Vizquel,O. |
0.251 |
0.272 |
If
historical precedence has relevance, then it's fair to assume that 8 out
of 10 of these players (below) will see a drop in their BHIPx% in
2006, which will likely translate into a lower Batting
Average. Let's take a look at the top BHIPx% producers of 2004 and
highlight the guys that are significantly above their 3 year
average. Did the Yankees overpay for a leadoff hitter (Damon) who
registered a 43 point rise in his Singles Percentage (over his 3
year average)? Our data suggests that Damon's 2005 average may have
been skewed more towards luck than skill.
|
BIPA |
2005 |
2004 |
2003 |
2002 |
3 year average |
|
Sanchez, A. |
0.336 |
0.347 |
0.284 |
0.306 |
0.312 |
|
Lofton,K. |
0.332 |
0.245 |
0.248 |
0.218 |
0.237 |
|
Jeter,D. |
0.314 |
0.252 |
0.331 |
0.302 |
0.295 |
|
Guillen,C. |
0.313 |
0.269 |
0.264 |
0.246 |
0.260 |
|
Sweeney,M. |
0.310 |
0.233 |
0.237 |
0.167 |
0.212 |
|
Kennedy,A. |
0.306 |
0.279 |
0.261 |
0.295 |
0.278 |
|
Conine,J. |
0.306 |
0.244 |
0.232 |
0.229 |
0.235 |
<Subscribers have access an additional 30 players, become an
Fantistics Member today>
Bottom Dwellers (Singles
Average)
Of the bottom 40 (91-130) the previous season
with over 400 ABs only 6 of the 42 bottom dwellers (in Singles %)
were not able to increase their singles % of balls hit into play the
following season. The average hitter in the bottom 20 hit at a .185
singles clip in 2004 and followed up with a 29% (.52) increase to
.237 in 2005. Those hitters that ranked 21-43 from the bottom hit at
a .216 singles clip in 2004 and followed up with a 9% (.19) increase
to .235 in 2005.
Obviously there is some significant correlation
in finding batters who might have been more than there fair share of
lucky or unlucky in a given year. Hitters like Sexson, Giambi,
Griffey, Cameron, Matos, Reyes, Martinez, and Alou all turned around their miserable 2004 into
strong numbers in 2005. Using BHIPx% we were able to forecast their
upturn in 2005.
|
BIPA\ |
2005 |
2004 |
|
Sexson,R. |
0.225 |
0.143 |
|
Glaus,T. |
0.221 |
0.176 |
|
Gonzalez,L. |
0.224 |
0.177 |
|
Fick,R. |
0.253 |
0.181 |
|
Ward,D. |
0.230 |
0.182 |
|
Phillips,J. |
0.204 |
0.183 |
|
Cameron,M. |
0.253 |
0.183 |
|
Beltran,C. |
0.237 |
0.186 |
|
Barajas, R. |
0.200 |
0.186 |
|
Giambi,Ja. |
0.256 |
0.188 |
|
Encarnacion,J. |
0.278 |
0.189 |
|
Griffey Jr.,K |
0.249 |
0.195 |
|
Gonzalez,Al. |
0.261 |
0.195 |
|
Crede,J. |
0.204 |
0.196 |
|
Castilla,V. |
0.209 |
0.198 |
|
Mench,K. |
0.201 |
0.199 |
|
Valentin,J. |
0.233 |
0.201 |
|
Jones,C. |
0.219 |
0.203 |
|
Matos, L. |
0.272 |
0.203 |
|
Mientkiewicz,D. |
0.198 |
0.204 |
|
Koskie,C. |
0.245 |
0.205 |
|
Palmeiro,R. |
0.227 |
0.206 |
|
Cruz,J. |
0.218 |
0.209 |
|
Hidalgo,R. |
0.194 |
0.209 |
|
Swisher,N. |
0.185 |
0.209 |
|
Wilkerson,B. |
0.223 |
0.210 |
|
Crosby,B. |
0.224 |
0.210 |
|
Morneau,J. |
0.196 |
0.211 |
|
Clark,T. |
0.251 |
0.211 |
|
Reyes,J. |
0.249 |
0.213 |
|
Pierzynski,A. |
0.224 |
0.216 |
|
Hernandez,R. |
0.250 |
0.218 |
|
Finley,S. |
0.183 |
0.218 |
|
Cabrera,O. |
0.222 |
0.218 |
|
Martinez, V. |
0.274 |
0.219 |
|
Pujols, A. |
0.256 |
0.220 |
|
Wells,V. |
0.224 |
0.221 |
|
Alou,M. |
0.276 |
0.221 |
|
Martinez,T. |
0.211 |
0.222 |
|
Teixeira,M. |
0.247 |
0.223 |
|
Pena, C. |
0.246 |
0.223 |
Who are the guys that are statistically in line
for a turn around this season? Based on what I described in the
study above. Our first step is to weed out the hitters that have
averaged a low BHIPx% on a consistent basis, as these hitters have
shown an inability to get singles at the league average. This is not
to say that some of the hitters who consistently hit a below average
number of singles don't make up for it in other ways. While looking
at the list above we probably need to pay attention to the names of
players who hit an extraordinary amount of extra base hits during
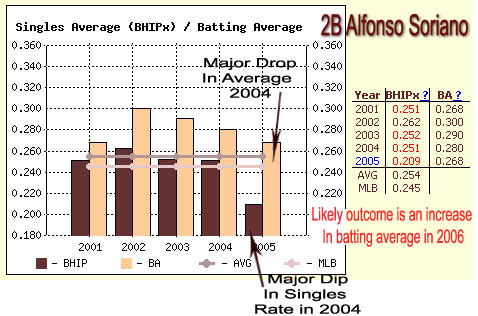
the 2005 season. One of the names that jumps out at us is that
of Alfonso Soriano who had a big season last year hitting a career
high 81 extra base hits, thus a higher than typical number of his
hits (of the extra base variety) are not included in this analysis.
However 2005 was also a low
(over a full season) in batting average for Soriano. Which could
partially be explained by his .209 singles average. For a player who
hits the ball as hard as Soriano does, this study points to Soriano
hitting into some bad luck last year. So if nothing else we should
see an increase in Soriano's BA in 2006.
Bottom Dwellers
(Singles Average) of 2005 (Guys who may turn it around in
2006)
Let's look at the guys who rang in at
the bottom last year, specifically the guys who might not deserve to
be there. Remember to consider that some of these guys belong there,
but there are those who had a one year aberration...and these are
the guys that we can count on for a turn around.
Highlighted below are the batters who had a downturn in 2005 and
are strong candidates for an upturn in 2006:
|
BIPA |
2005 |
2004 |
2003 |
2002 |
3 year average |
|
Huff, A. |
0.229 |
0.256 |
0.242 |
0.268 |
0.255 |
|
Jones,J. |
0.229 |
0.240 |
0.296 |
0.280 |
0.272 |
|
Wilson,J. |
0.229 |
0.265 |
0.244 |
0.243 |
0.251 |
|
Payton,J. |
0.227 |
0.241 |
0.253 |
0.264 |
0.253 |
|
Nixon,T. |
0.225 |
0.284 |
0.268 |
0.203 |
0.252 |
|
Pierzynski,A. |
0.224 |
0.216 |
0.269 |
0.265 |
0.250 |
<Subscribers have access an additional 30 players, become an
Fantistics Member today>
Conclusion
1. If a player has a consistent
history at or above the average Singles rate (.250) and follows it
up with a poor Singles % season (20 points below his 3 year average)
he's a good candidate to increase his Batting Average the following
season (taking into consideration age factors, and batting eye
indicators).
2. The reverse is true for a
player that hits 20 points (or greater) above his 3 year average.
3. If a player is
consistently at .270 or above in singles % and has a poor singles
average in the most recent year, we should expect a bounce back in
singles average the following season (which will most likely lead to
an increase in BA.)
4. If a player is consistently at a .230 singles average or
below and has a singles percentage above .260 in the most recent
year, then excluding favorable batting eye indicators and age
indicators, we should expect a downturn)
Looking Ahead
At Fantistics InsiderBaseball.com, we've constructed a new set of forecasting tools to help
you in your
player evaluation. Starting immediately and throughout the season we
are displaying a graphical representation of Singles Percentage (BHIPx%)
for each hitter. Our goal is to provide method to identify the
players who early into the season are just hitting into bad luck, or
on the flip side are overachieving. Some of the player trends may
last the entire season, but a great many will not.
|