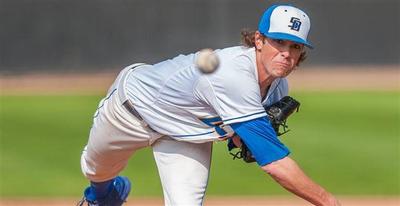
In our continuing series on player recommendations, today we take a look at the pitchers who are deviating from their projected production.
I want to start this year's Pitcher segment by saying: historically pitchers have a much more difficult time reverting to their historical mean, than do hitters. Especially top tier pitchers (reason unknown, apparently if something within a pitcher's makeup is off, it's much harder to perform at the elite level than at a mediocre level). While approximately 80% of hitters will revert to the typical production ranges, only 65% of pitchers will find their normal ranges. Thus trading for an under-producing pitcher has more risk than trading for an under-producing hitter. Similarly trading away a over-producing pitcher has a higher possibility of working out against you (vs trading an over producing hitter). Last year in the first pitchers segment analysis, we suggested that Cliff Lee owners should sell high. Needless to say that was a poor recommendation, but it was not based on guess work. Unprecedented seasons will happen for certain players, and their production will defy their underlying fundamentals (notice the difference a season makes for many of these guys).
The recommendations are a combination of both Regression to the Mean and of the underlying SaberMetric fundamentals. Squarely put, it's a percentage game: 65% of these recommendations will be spot on, 35% will be awry. I wish the percentages were higher, but it's the nature of the beast. That said, let's get to it:
Please refer to the Batters article for an explanation of the terms used such as FPI (FPI^ = FPI change over our preseason projection used to access the over or under production year to date), and the use of the Fantistics Advanced Stats Database. OAVG, measures the opposition YTD batting average against each pitcher. Since we are all familiar with Batting Average, it's easy to see from this stat who the under and overachieving players are. We are fairly confident in saying that Mark "Milton" Buehrle is not going to hold the opposition to a .213 batting average this year. This is not to say that Buehrle isn't a top 60 pitcher, but his strikeouts per Innings Pitched (.63), indicate that his recent success is not likely sustainable. As a point of reference we consider pitchers with a K/Inning ratio of less than .65 to be a very risky proposition (more on this in the paragraphs below).
Balls Hit into Play Success % or BHIP% There have been numerous studies (namely Voros McCracken's article) and rebuttals on the theory that "all balls put into play stand an equal chance based the law of percentages"....in other words, all pitchers stand the same chance of recording an out verses the batter reaching base on balls hit into play based on the average ratio of hits/outs. Overall, or internal analysis agrees with this observation however when you only consider the top echelon of hurlers, there is a significant correlation which indicates that some pitchers, particularly successful ones, do have influence over balls hit into play. The difference between having a .200 and .300 BHIP% against can mean 3 to 4 extra hits allowed per game. Which could play havoc on the WHIP, ERA, and Win categories.
The average BHIP% given up by pitchers is .294 (given up by the top 130 starters). Listed in the analysis will be each pitchers current BHIP% and their 4 year average (if available). Using this single indicator we can determine which pitchers have been "lucky" or "unlucky" to date.Pitchers who have been extremely fortunate on balls placed into play (less than a .230 BHIP%) are : Garza,M. (.184), Volquez,E., Wakefield,T. , Volstad,C., Weaver,J., Lilly,T., Gallardo,Y., Bush,D., Sanchez,J., Millwood,K., Bannister,B., Jurrjens,J., Sampson,C., Buehrle,M., Maine,J. (.231). As mentioned above, a regression to the MLB average (.294) or their 4 year average could mean a significant rise in all of the undesirable categories including ERA and WHIP.
On the flip side, Pitchers who have been extremely unfortunate in balls placed into play (more than a .335 BHIP%) include: Eveland,D. (.415), Beckett,J., Paulino,F., Slowey,K., Bass,B., Lester,J., Eaton,A., Blanton,J., Sonnanstine,A., Wellemeyer,T., Hamels,C., Nolasco,R., Perez,O., Miner,Z., Meche,G., Correia,K., Olsen,S., Vazquez,J., Hammel,J., Sanchez,A., Floyd,G., Lee,C., Lincecum,T., Pavano,C., Boggs,M., Stults,E. (.336). Not a coincidence is that many of these pitchers are also pitchers who do not have a high Strikeout ratio, which has increased their susceptibility to poor luck on balls hit into play.
One of the key indicators to pitching success in the majors is Strikeouts Per Innings Pitched (K/IP). Very few pitchers are successful with a K/I ratio below .65. The simple logic behind this ratio threshold is that balls put into play stand the chance to create runs while strikeouts obviously do not. High K/I ratios typically indicate that the pitcher has over powering stuff (usually a very good fastball), or in a few cases has masterful command of the strike zone with some type of movement (ala vintage Greg Maddux). We do see pitchers every year who come in with low K/I ratios, but they rarely maintain success consistently year over year. Guys who have low ratios are usually hit or miss in their outings (Quality Starts), and they are also highly reliant on the homeplate umpires (some have wider zones than others). Guys on this list in the include Hernandez,L., Boggs,M., Ponson,S., Pavano,C., Karstens,J., Silva,C., McCarthy,B., Cook,A., Garland,J., Laffey,A., Duke,Z., Carmona,F., Hampton,M., Feldman,S., Perkins,G., Blackburn,N., Harrison,M., Bass,B., Suppan,J., Reyes,A., Saunders,J., Sampson,C., Miner,Z., Cabrera,D., Eaton,A., Looper,B., Marquis,J., Pineiro,J., Pelfrey,M., Olsen,S., Blanton,J., Hammel,J., Washburn,J., Braden,D., Contreras,J., Bush,D., Jackson,E., Geer,J, Lohse,K., Correia,K., Hendrickson,M., Volstad,C., Bannister,B., Moyer,J., Davies,K., Guthrie,J., Buehrle,M., Sonnanstine,A., Lannan,J., and Wakefield,T. Some of these guys can look like a CY Young pitcher during various points of the season, whether it's just in one boxscore or several...but very few string together an entire season of Quality Starts year after year. One of the determinants in my Buy, Sell recommendations is the K/I ratio as compared to my preseason projection. You'll see that some of the under performing pitchers are considerably off in their ratios this early season...which could be an indication that something is wrong...it might just be a dead arm period...or a small sample size of only 5 or 6 starts...regardless it is a concern. Here are a few pitchers whose K/Inning ratio is significantly less than typical so far this year (greater than .10 difference) and who are struggling as well: Martis,S., Pelfrey,M., Sabathia,C., Niemann,J., Owings,M., Arroyo,B., Scherzer,M., Marshall,S., Kazmir,S., Park,C., Sanchez,A (DL), Cabrera,D., Pettitte,A., Snell,I., Burnett,A., Chamberlain,J., Oswalt,R., Wellemeyer,T., Myers,B., and Blackburn,N.
Another indicator included in this year's analysis is Expected ERA (XERA) vs Actual ERA. As many of you know, ERA can be a category that does translate perfectly to a pitchers actual production. Those familiar with or player production charts already have a handle on the formula created by researchers Gill and Reeves which approximates the deserved ERA using a series of stats and ratios. Pitchers who are showing an overly inflated ERA (+1.00) in relation to their actual production include: Pavano,C., Kazmir,S., Masterson,J., Purcey,D., Reyes,J., Park,C., Young,C., Garza,M., Kershaw,C., Eaton,A., Reyes,A., Contreras,J., Verlander,J., Liriano,F., Jimenez,U., Feldman,S., Maine,J., Silva,C., and Perez,O. Pitchers who are showing an a better ERA (-1.00) then deserved include: Hendrickson,M., Hammel,J., Lannan,J., Braden,D., Cain,M., Lee,C., Myers,B., Outman,J., Looper,B., Bass,B., Bannister,B.
By looking at our key indicators (which can be found in our Advanced Stats Database you can tell who has reached a peak and who has bottomed out....it's your advantage to know where the players are projected to produce and were they are today. It's difficult to get top dollar on relatively unknown players who are over producing, like Russ Ohlendorf ...and if you can not, then it makes more sense to keep them than trade them cheaply. However for the over producers who are seasoned, you should be able to get considerable compensation in return. Good pitching is difficult to find, however it's also very volatile. You'll see a sell recommendations on pitchers such as Brian Bannister and Scott Richmond. Both are pitching well above their mean and front runners in the Cy Young race, however neither will likely sustain their current pace.
Sure some players will continue on their downward slope and others will continue to rise, but in the end...."regression to the mean" rewards those with patience. With 6 weeks in the books, there are still 20 to go....happy trading!
Click here for the report: http://www.fantistics.com/baseball00/StrategyPlus-Pitchers-May2009.pdf
-Anthony A. Perri
Statistician and Publisher