
The player news is fairly slow this time of season as the players don't start arriving to camps until next week. However it's a great time to take a look back and see what's trending.
![]()
2010: Say Hello to The Dominance of Starting Pitching Part 2
On Tuesday we took a look at the shift from hitter or offensive production during the decade that was (00s). Today, let's take a look at the other side of the equation: Starting Pitching.
Let's start with the Fantasy Baseball 5x5 $ values of the top 120 starters. According to our data, from 2000 to 2009, the average fantasy value for the top 100 pitchers has risen from $11 to $13, and FPI or Fantasy Production Indicator (which measures fantasy contribution per inning) has risen from 1.20 to 1.35. So while Hitter values lost about 10-12% during the decade, pitcher values have gone up at a 10-12% clip.
Below is a more informative look at the tiers of starters as sorted by WHIP (a credible indicator of fantasy value as ERA and Wins are also closely correlated with WHIP). Here’s a listing of the pitchers with at least 120 IP and sorted by the lowest WHIPs in the year 2000 (grouped by top 10/20/30/40) :
|
2000 WHIP (Walks+Hits/IP) |
|||
|
Top 10 |
1.10 |
1-10 |
1.10 |
|
Top 20 |
1.17 |
11-20 |
1.23 |
|
Top 30 |
1.21 |
21-30 |
1.30 |
|
Top 40 |
1.25 |
31-40 |
1.36 |
Now fast forward to 2009:
|
2009 WHIP (Walks+Hits/IP) |
|||
|
Top 10 |
1.07 |
1-10 |
1.07 |
|
Top 20 |
1.12 |
11-20 |
1.17 |
|
Top 30 |
1.16 |
21-30 |
1.22 |
|
Top 40 |
1.18 |
31-40 |
1.25 |
Hence the 4th tier, the 31st-40th best pitchers in 2000 averaged a 1.36 WHIP, and that same tier pitcher is now averaging a 1.25 WHIP...amazing how rapid the shift has been in less than a decade....and the likely culprit was of course Steroids or PEDs.
At the same time among the top 120 pitchers, the average ERA has dropped from 4.61 to 4.40, and the average WHIP has also dropped from 1.43 to 1.35. While Fantasy Production Index or Indicator (FPI) has increased by 9% to 1.30 from it’s low point of 1.21 in 2000. Clearly pitchers have rebounded from the early lows of the 2000 decade.
Additionally and not surprisingly, pitcher projections have become more predictable than they were to start the last decade. Does anyone remember early in the 2000s when famous Sabermetician Bill James wouldn't even do pitching projections because of his frustration with their predictability? I remember this frustration first hand, and now we know the culprit (PEDs). Don't get me wrong, they'll always be an increased injury factor as pitchers are just more injury prone (the "unnatural" pitching motion). Outside of the injury factor, I routinely correctly project an almost equal number of directional upswing/downswing among both hitters and pitchers. The stigma of unpredictability is starting to fade.
My three observations:
-
On average, Pitchers are performing at a higher level than at any point in the last 10 years. The relative value of pitchers has increased over the decade.
-
Pitcher Production predictability has increased significantly over the decade.
-
Similar to hitters, the degree of separation between the upper tier pitchers and the 2nd tier is less pronounced than it was in the past.
In looking at the trend among both pitchers and hitters, the overriding factor is that outside of a very few players, there is a tendency to overvalue the top tier of players. When in essence the degree of separation between the top 40 players for both hitters and pitchers is now much smaller than it once was. Hence in an auction draft, I prefer to stay out of the bidding on near top tier talent as the relative gain in performance will likely not exceed the incremental price difference between the next tier. As an example, take a look at the incremental differences between the 11-20th and the 21-30th player range for WHIP and SLUG....it's not nearly what it once was.
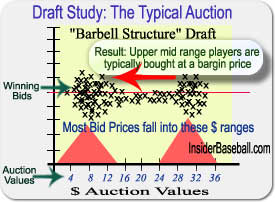
As we have discussed in the past, winning auction prices take a barbell structure, and now more than at any other time over the last 10 years, there is more value closer to the middle.
For those that use our player projections software, you already know that unlike generic rankings or valuations you may see elsewhere, the software does the math for you. It actually computes auction values based on these incremental stat differences and also is bases it's computations on your particular league settings. Thus the values are a true representation of player contribution in your exact league format. Similarly for those who play in a serpentine draft (non auction league), the true lesson for the stat trends comes from our Value above Mean (Position Scarcity Formula) which ranks the players according to the incremental differences between the stats and the other roster positions.
In a coming blog we'll discuss the relative fantasy value of pitching from a simple mathematical perspective.
![]()
Recent Sabermetic Twits from Fantistics on Twitter (we are brand new to twitter, come join us as we build our social presence):
Statistician and Publisher -Fantistics Insiderbaseball.com
![]()
![]()
![]()
![]()
![]()


Jay
Feb 12, 10 at 10:18 PM
How did the tide of new, pitcher-friendly parks and the advent of the humidor in Coors factor into this analysis?
Anthony Perri
Feb 12, 10 at 10:18 PM
Good Question. The numbers are strictly based on performance and not normalized. However there have been more hitter-friendly ballparks built since 2000, than pitcher-friendly. By my count, based on homeruns allowed as compared to the mean, Great American, Miller, Citifield, Yankee, Citizens, PNC are all more hitter friendly than their predecessor. And that wasn't a typo on Citifield, last year Citifield was above the mean in HRs allowed. On the other end, only Busch, Petco, and Nationals appear to be less slugger friendly than their predecessors.
Jay
Feb 12, 10 at 10:18 PM
Why use HRs only? Wouldn't park effects be better, since they include a broader scope of statistics? For instance, Citi Field is indeed HR-friendly, as you mentioned. It's also 3B-friendly. However, it has such a dramatic effect on H, 2B, & BBs that it ends up being decidedly pitcher-friendly in spite of its proclivity towards HRs.
Anthony Perri
Feb 12, 10 at 10:18 PM
Yes, park factors should be a consideration, but the other ballpark factors you mention are all a clean sweep in favor of Citi field being more favorable to hitters over Shea. Take a look at the most recent 3 year history of Shea. Based on the 3 year average, we see lower production at each of the listed categories (R, H, HR, 2B, & BBs). Granted it might turn out to be the opposite as one year is a poor barometer....but that's all we have right now.
Going back to the original post, there should be no debate that the fantasy landscape has shifted from the start of the last decade to the end of it. Is PEDs the reason? I think it's a big part of it...but I can not say for sure. No one can, unless we knew every player who injected, and stil lthere would be conjecture. It's just awfully coincidental that the greatest peak of offensive aggression in MLB history coincides with the PEDs scandal.
It could be the darn baseballs (as Curt Schilling once claimed) but I am confident it's not the establishment of pitcher friendly ballparks...if anything I believe the opposite would be true...and the data seems to agree.
Jay, thanks for reading.
Andrew S
Feb 12, 10 at 10:18 PM
There is a bit of a debate going on on the Cafe Forums regarding the effect of the new ballparks. Some are taking the stance that Ballpark Runs Effect (ESPN's Park Factor) is more relevant than your reference to Ballpark HRs. With the assumption that the power outage may not be PEDs, but the effect of the new pitcher freindly ballparks. Do you have any analysis on the effect of the new ballparks in relation to runs factor?
Scott K
Feb 12, 10 at 10:18 PM
Since pitching is becoming more dominant, should we change the splits ratio from its default 68% hitting, 32% pitching to a more 50% - 50% split? Just wondering your thoughts on the matter.
Anthony Perri
Feb 12, 10 at 10:18 PM
Andrew, Thanks for the suggestion. I've devoted a blog to this today: http://bit.ly/dve1Bp
Anthony Perri
Feb 12, 10 at 10:18 PM
Scott good question. The short answer is no, because the Fantistics valuation model already comes closer to valuing pitchers closer to their intrinsic value than most other rankings/valuations out there. So we want the best outcome at the least cost. Sort of like going into a car dealership. You want the car, but you don't want to pay much above what the dealer will let you have it for.
I am currently updating some research that I had previously done with regards to positional probability. I hope to post that in the days ahead along with some strategy.
Andrew S
Feb 12, 10 at 10:18 PM
At the risk of badgering you, can you expound on this: "Additionally the strength of a lineup can exaggerate the effects of a ballpark." BTW: I love your site and the projections software, I have won 8 league championships with your help. Keep it up.
Anthony Perri
Feb 12, 10 at 10:18 PM
Andrew here's my theory on how park factors can be exaggerated.
Park factor uses Runs Scored for the home team and follows that same home team to other stadiums. Now here’s the faulty premise which can exaggerate the effects of a ballpark, and why it's not a true neutral indicator:
If a team has more hitters in its lineup that are built to capitalize on the dimensions or atmospheric variables, then that team can exasperate the Park Factor. Let’s say, Home Team A & Home Team B both play at a pre humidor Coors field. Team A is stocked with 9 ground ball hitters (think Luis Castillo) and Team B is stocked with 9 fly ball hitters (think Carlos Pena). Which team is going to capitalize on the advantages or disadvantages of a ballpark better? Chances are that it will be Team B, the team with hitters that are more able to utilize the dimension of the ballpark or benefit of altitude. Sure Team B’s production on the road is noted, and compared to their home park, but the degree to which it is…is accentuated by the fact that he capitalizes on the altitude more often than Team A. For Team A (ground ball hitters without power), the advantages of elevation (in this case) could be negated based on lack of use or instances. Therefore I surmise that there would NOT be a wide variance in home/away runs scored for this type of lineup. Hence the exaggeration potential.