
Consistency Factor
Consistency Factor: an indicator designed to measure a player's Weekly and/or Daily quality production output using Fantistics Fantasy Production Indicator (FPI).
For anyone who has played in a Head to Head
league, you probably already know the importance of Weekly
Consistency in player production. Similar in nature to the
popular indicator which measures a pitcher's Quality Starts
(Bill James), Consistency Factor gives us an indicator
of a batter's quality games or quality weekly output.
Last week we took a look at
The Inconsistent Player. This week we look at those
players that are consistent or were last season.
As a benchmark we are comparing each hitter's daily/weekly
production to the average production of the top 250 major league
hitters. If a player's production for a particular day or week
is above the group mean, then the player registers a quality
game/week. These games/weeks are accumulated and the sum is the
output we call Consistency Factor . Consistency factor is
based on our Fantasy Production Indicator (FPI)
which triggers a Quality Game when the player's production exceeds
.65.
Below are the most consistent
batters in 2009 with their 3 year averages. The number of weeks
their output exceeded the average threshold factor of their peers
(FPI), they registered a quality week. As you can see below,
Albert Pujols was consistent 20 of his 26 weeks (a 75%
consistency), and has been consistent 80% of his weeks over the
last 3 years. This of course does not come as a surprise to
anyone. What we are looking for in this exercise is players who
showed remarkable consistency in 2009, but have not shown the same
consistency in the past.
Again the purpose of this indicator is to allow us to easily recognize
those hitters who produce on a consistent basis and those that
do not. For those who play in a weekly head to head format, the
value of this indicator is obvious. In this segment, I am making
a case for Consistency Factor as a relevant indicator for all
fantasy or rotisserie league formats.
My premise here
is simple: established players who do not produce quality
output on a consistent basis are at higher risk to achieve similar
success in the future. Essentially we want players who
produce consistently rather than in sporadic episodes. The
reasoning is a derivative of the laws of probability,
consistency is paramount to lowering our risk...the more
observations the better. Consistency by
it own summation does not come cheaply on draft day, as a
consistently productive player will logically produce the best
stats overall. Thus the real value of the Consistency Factor is
to: 1. find or exclude the players who are not
consistent in their production and 2. target young players
who are showing consistent patterns. There are a distinct group
of players that mask their yearly results based on a few hot
weeks of production. As a fantasy GM in a non weekly or head to
head format format, you might be saying: "SO WHAT...as long
as he produces what is expected in his final year end statistics".
Here is the
reasoning why I am suggesting that inconsistent players be
avoided: Streaky players, for the most part, will never be
consistent players. Thus placing faith in a player who
only produces in small time frames exposes his fantasy GM to
injury and playing time risks that are beyond the normal scope. Injury Risk
Consideration It's simple,
stay away from players who are both inconsistent and injury
prone. The premise: consistent players will produce evenly
throughout the season and will not be as adversely affected by
missing playing time. Their opportunities for achievement are
more spread out, which reduces their risk. Playing Time
Risk Consideration A perfect
example of a player who produced in streaks is Geoff Jenkins.
Coming into 2006, Jenkins was the model of inconsistency for a
player who usually ended the season with decent yet
unspectacular numbers. A 27 HR/90 RBI/.290 BA were numbers most
typical of his yearly production. Yet Jenkins only had 10 out of
26 weeks of quality production in 2004, and 11 out of 26 weeks
in 2005. Most players in this final stats range usually have
about 15 quality weeks of production. Jenkins was getting by
with 40%+ less consistency. In 2006 however, Jenkins hit such a
long streak of non production, he was essentially benched before
he ever had a chance to reach his typical hot spurt. Hence the
playing time risk consideration. How to
properly use Consistency Factor These are two
examples of the risk in taking established players who are not
consistent in spacing their production evenly throughout the
season. A premise based human behavioral patterns and the laws
of probability. In thumbing through a list of consistent players
and inconsistent players over the last 5 years, in most cases
inconsistent weekly players (despite masking some years
with quality year end numbers) have had more instances of
disappointing seasons. To use this tool properly we need to
compare apples to apples. Comparing Albert Pujols'
consistency factor to that of a Geoff Jenkins doesn't aid us in
any manner, as Pujols is a much more valuable player and this
will not come as a surprise to anyone in your draft either.
Here's an example
of how to effectively use Consistency Factor: There are many
players that are closely valued during the fantasy draft season.
Consistency factor can be effectively used to make decisions
when comparing similar commodities. Two such players in this
year's draft are (typical 5x5 Roto format): Kevin Youkilis
Derrek Lee: 92 R/31 HR/101 RBI/.294 BA/2 SB $15 EAV$ (6rd round 7th selection ADP)
According to ADP (Average Draft Position - included in our projections software) Youkilis is being selected 3 rounds ahead of Lee. I believe this gap should be much closer if not in reverse. Consider that Youkilis produced above average results in 13 of his 23 playing weeks last year (57%), while Lee produced above average production in 17 of his 23 weeks (78%). Not only was Lee's production better last year, but Lee has produced on a more consistent basis over the last 3 years (70% to Fielder's 51).
My Bottom line: Without any other factors to consider, and based on these consistency indicators, I would rather ride with Lee this year than I would with Youkilis. It's certainly not a 'slam-dunk", as these are 2 very similar commodities. In the end the fantasy team that comes out ahead, is usually the owner that knowingly or unknowingly does a better job of consistently playing the percentages.
There are a considerable amount of easier calls to make when looking at those players who had a bounce back season in 2009 without the consistency levels that we like to see. Players that I'm weary about heading into 2010, who had an above average season in 2009 (but have a poor 3 year consistency factor) include: See full list (players highlighted in red) here.
Here's the guys that we highlighted last year (prior to 2009):
Aubrey Huff, Stephen Drew, Vernon Wells, Michael Young, Carlos Delgado, Mark DeRosa, Melvin Mora, Mike Cameron, Ty Wigginton, and Bengie Molina. (see past player mentions). Michael Young was the only exception in 2009.For those who are interested in consistency factor (register), it's conveniently listed for each player in the Forecaster section of the projections screen (see example below) and also are listed as a sort-able column as wellon the projections screen (Select Columns WC for Weekly Consistency and DC for Daily Consistency).
Statistician and Publisher -Fantistics Insiderbaseball.com
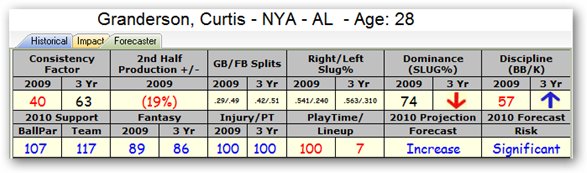
See our Consistency Factor in action using our Player Projections Software in the Forecaster tab for each player. You can also sort a player's 2009 Weekly Consistency (WC) and Daily Consistency (DC) by selecting to view those columns in the Player Projections software.
![]()
3 Comments
Leave a Reply
Anthony A. Perri is the founder and the resident "Stats Nerd" here at Fantistics. Anthony is the designer of the Fantistics Projections, Grading, & the VAM drafting strategy models. His fantasy expertise has been published in several national publications, and can be heard on their nationally broadcast SiriusXM (ch87) Fantistics Sports Radio Show. Anthony has an MBA and worked as a quantitative analyst within the investment industry from 1986-1999. Transplanted from New York (still a Mets and Giants Fan), he currently lives in Arizona with his wife Mary , daughter Hannah, and son Adam. Having won a "trophy room" of Fantasy Sports Championships over the last 25 years, he hopes to continue to lead you in the same direction.


justin
Feb 26, 10 at 11:41 PM
why are the consistency percentages in the software different than the ones on your list?
in my projections software i have Derrek Lee as 87% for 2009 and 3 yr at 97%
in your list you have him at 77% and 70%
Anthony
Feb 26, 10 at 11:41 PM
Good question Justin. One is based on percentage of weeks and the other is based on percentile. The software shows percentile in the forecaster area. Please note that you can also see the actual number of Weeks and Days of consistency in the Projections Area of the software by selecting the columns WC (Weekly Consistency) and DC (Daily Consistency).
Paul
Feb 26, 10 at 11:41 PM
Is there a range we can compare from worst to best for the WC (Weekly Consistency) and DC (Daily Consistency)?
For example, Jose Reyes has WC 4 and DC 17. That's low right and would be someone to avoid?
What's this telling us?
Thanks