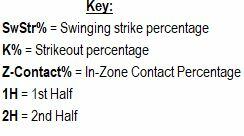
Swinging strike rate, or the percentage of pitches that result in a swing and a miss, is one of the most powerful tools for any fantasy player to utilize when attempting to evaluate starting pitcher performances. The calculation of the metric is incredibly simple once you understand what it's measuring:
SwStr% = Swing and misses / Total pitches
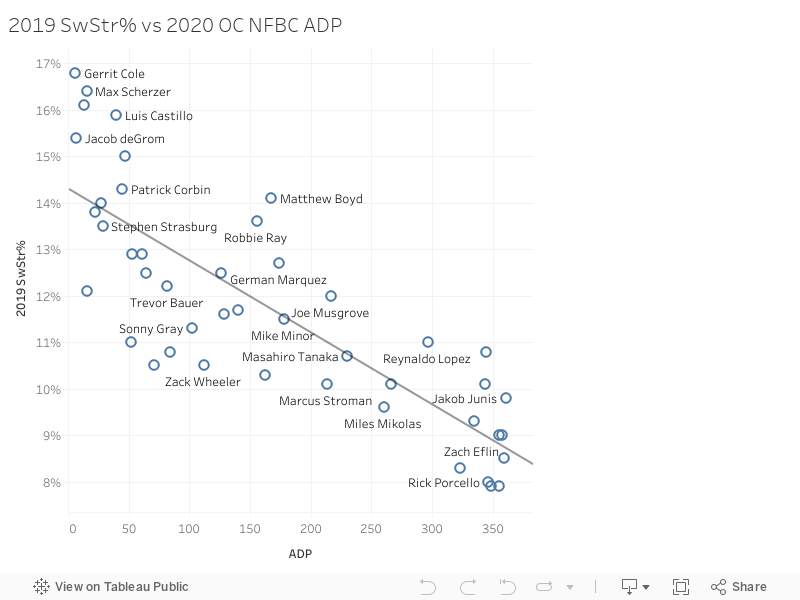
Sports Info Solutions and PitchFX both track and provide the inputs for this metric and the stat has been publicly accessible for nearly a decade. The advent of swinging strike rate was a breakthrough for fantasy baseball analysts and those who project player performances because it was the first time we could begin quantifying how dominant a pitcher was relevant to others in the league. As such, swinging strike rate became the best metric we had for predicting and correlating a pitcher's raw strikeout rate. Case in point, the correlation between swinging strike rate and strikeout rate for all starting pitchers with more than 100 IP in 2019 was an impressive 0.87, one of the highest correlations you will see between any two metrics in baseball!
So, now that we've established the importance of swinging strike rate, we can begin delving into ways to apply it to your fantasy baseball drafts. Given the accessibility of the stat and the strong correlation with strikeout rate, pretty much anyone can target "high strikeout pitchers" and luck into a pitcher who also has a high swinging strike rate. So how do we get an edge?
The answer is by looking at metrics beyond just strikeout rate to better understand how sustainable a pitcher's strikeout rate will be. Here are the three steps I took:
1) Analyze the data to identify pitches who made year-over-year gains from 2018 to 2019. By identifying the players that saw a surge (or a decrease) in swinging strike rate, I surmised that I will be able to better pinpoint the starters who might carry over that change into 2020.
2) Find the metrics that are strong leading indicators for swinging strike rate. Those leading indicators are four-seam fastball velocity and average spin rate, which showed to have a correlation of 0.52 with swinging strike rate for all qualified starting pitchers who threw more than 25% four-seam fastballs in 2019. If you're curious why I only included 4-seam fastball and their associated spin rates, check out these two great articles on MLB.com explaining spin rate (here and here).
3) Does the change in swinging strike rate translate to lower in-zone contact (z-contact%)? While z-contact% is more of a descriptive stat rather than an indicator stat, it's an important one to measure since it's explaining if the increase in swing and misses is translating to a change in the batted ball result from the at-bat and distinguishes if the increase swing and misses are due to better stuff (i.e. missed bats inside the strikezone) or simply due to players chasing pitches outside of the strikezone because of better movement, etc. The analysis of chase rate (o-swing%) out-of-strikezone contact (o-contact%) each could partially accomplish this goal, as well.
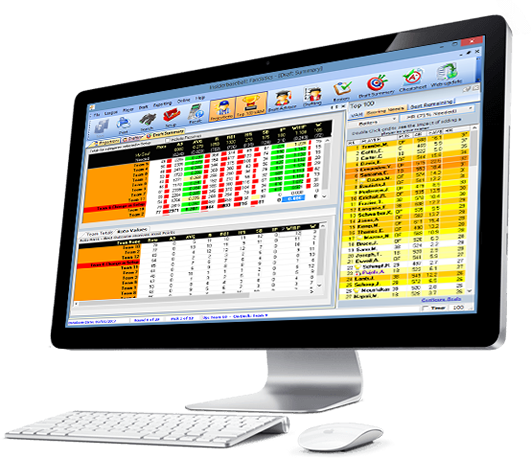
Here's a look at the leaderboard to see both aspects of my research:
Click here to access an interactive version of the table above.
Please note: When looking at the leaderboard above, be sure to consider the percentage of time the starting pitcher deployed his four-seam fastball before drawing any meaningful conclusions on a change in his four-seam fastball velocity. This is because the less the fastball is thrown, the less of an impact it would have had on his overall SwStr%.

Helping you win your
Fantasy Baseball League in 2020